How many pools should a route run per day?
There’s no fixed answer to how many pools a route should run per day. It depends on three things that vary from business to business: how close the stops are to each other, how complex each visit is, and how much time actually disappears into driving between properties. Any number quoted without those three factors attached is a guess, not a benchmark.
Why there’s no single right answer
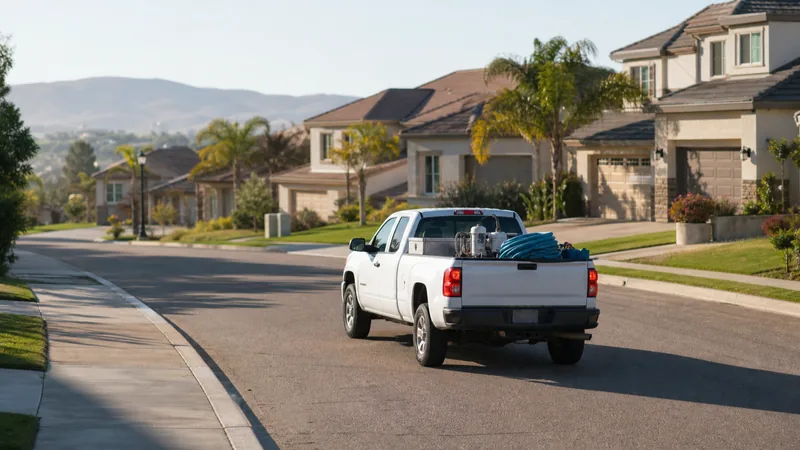
It’s tempting to want a clean number: ten pools a day, fifteen, twenty. The honest answer is that a defensible number only exists once you know the route it’s describing. A compact suburban route with quick chemical checks supports a very different daily count than a spread-out rural route with full cleanings, even if both routes technically have “the same number of pools” on paper.
That’s the frame for the rest of this guide. Instead of naming a number and asking you to hit it, the sections below walk through the three variables that actually determine capacity for a specific route, plus a practical way to measure your own instead of guessing.
Route density is the biggest factor
Of the three variables, route density usually has the largest effect on how many stops fit into a day. A route where properties sit close together, the same subdivision, a few adjacent streets, loses far less time to driving than a route covering the same number of stops spread across a wider area. Two routes with identical pool sizes and visit frequencies can support very different daily stop counts purely because of how the properties are laid out geographically.
This is also the variable most within an operator’s control. New customers can be evaluated partly on how well they fit an existing route’s geography, not just on whether they’re a good account on their own. Route optimization that resequences stops for the shortest realistic path helps make the most of whatever density a route already has, but it can’t manufacture density that doesn’t exist. A route spread across a wide service area will always have a lower practical ceiling than a tightly clustered one, regardless of how well the stops within it are sequenced.
Pool size and service complexity change the math
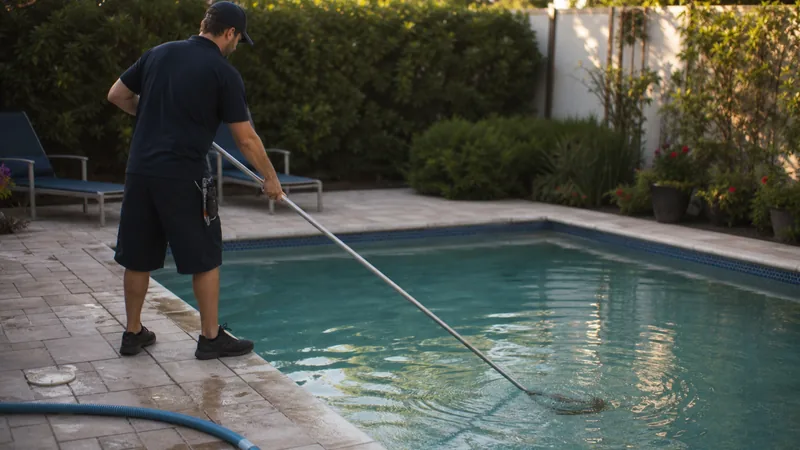
Not every visit takes the same amount of time. A routine visit, a chemical check and a quick skim, might take ten or fifteen minutes on a well-maintained pool. A full cleaning with brushing and vacuuming takes meaningfully longer, and a larger or more complex pool (multiple bodies of water on one property, heavy equipment, unusual features) adds time on top of that. A route mixing both types of visits in the same day needs to account for that difference rather than assuming every stop takes roughly the same amount of time.
Commercial or larger properties compress the math further. A single large commercial pool might realistically take the place of two or three residential stops in terms of time budgeted for the day, which matters when planning how many total accounts a route can support.
Drive time between stops adds up faster than expected
Ten minutes between stops doesn’t sound like much on its own, but it compounds quickly across a full route. A route of fifteen stops with ten minutes of drive time between each one adds up to well over two hours of pure driving in a single day, before accounting for the service time at each property itself. That’s easy to underestimate when planning a route on paper, since ten minutes feels negligible in isolation and only becomes visible once it’s multiplied across every gap in the day.
This is exactly the kind of cost that recurring routes built with geography in mind, rather than the order customers happened to sign up in, are meant to reduce. A route planned around actual proximity instead of signup order recovers time that would otherwise disappear into unnecessary backtracking across a service area. For a closer look at grouping stops by geography instead of signup order, see how to plan an efficient pool cleaning route.
How to actually measure your route’s realistic capacity
Guessing capacity from memory or from how the route was originally planned tends to be optimistic. A more reliable approach: track the actual time spent, including drive time, on five to ten consecutive visits on a real route, rather than assuming based on the plan. That gives you real data on what a typical stop actually costs in time on your specific route, with your specific mix of visit types and geography.
Once that real number exists, it’s straightforward to work out a realistic daily capacity: total available working hours divided by the actual average time per stop, with some buffer built in for the inevitable outlier visit that runs long. This is a better foundation for scheduling decisions than any generic industry figure, because it reflects your route rather than someone else’s.
Logging visit times in the field helps you get this right

The measurement described above is far easier with a system that records it automatically rather than a manual stopwatch exercise done once and then forgotten. A mobile app that logs visit times automatically, timestamping when a technician starts and finishes each stop, builds up real duration data over weeks and months without anyone having to think about it. That ongoing record is more reliable than a one-time measurement, since it captures variation across different pools, seasons, and technicians rather than a single sample day.
Over time, that data also flags when a specific property is consistently taking longer than expected, which is useful information whether the answer is adjusting that customer’s price or simply better planning around it on the schedule.
See how PoolTechDesk combines route optimization with automatic visit-time logging to help you plan realistic daily capacity.